
The piece, Investor Brief: Are IPOs a Mission to Mars or Grounded on Takeoff?, delivered a review of the company’s astronomical valuation and the historical underperformance of IPOs in general. Since then, we have continued to receive many questions about SpaceX; some around how to gain exposure, and others around how to avoid exposure. If nothing else, Elon Musk certainly knows how to generate buzz.
The narrative surrounding space exploration and AI has absolutely captured the public’s imagination. Many are excited at the prospect of “getting in on the ground floor”, so to speak, by purchasing shares of SpaceX at the IPO, particularly since reports indicate the company may allocate up to 30% of shares to retail investors, well above typical IPO levels.1
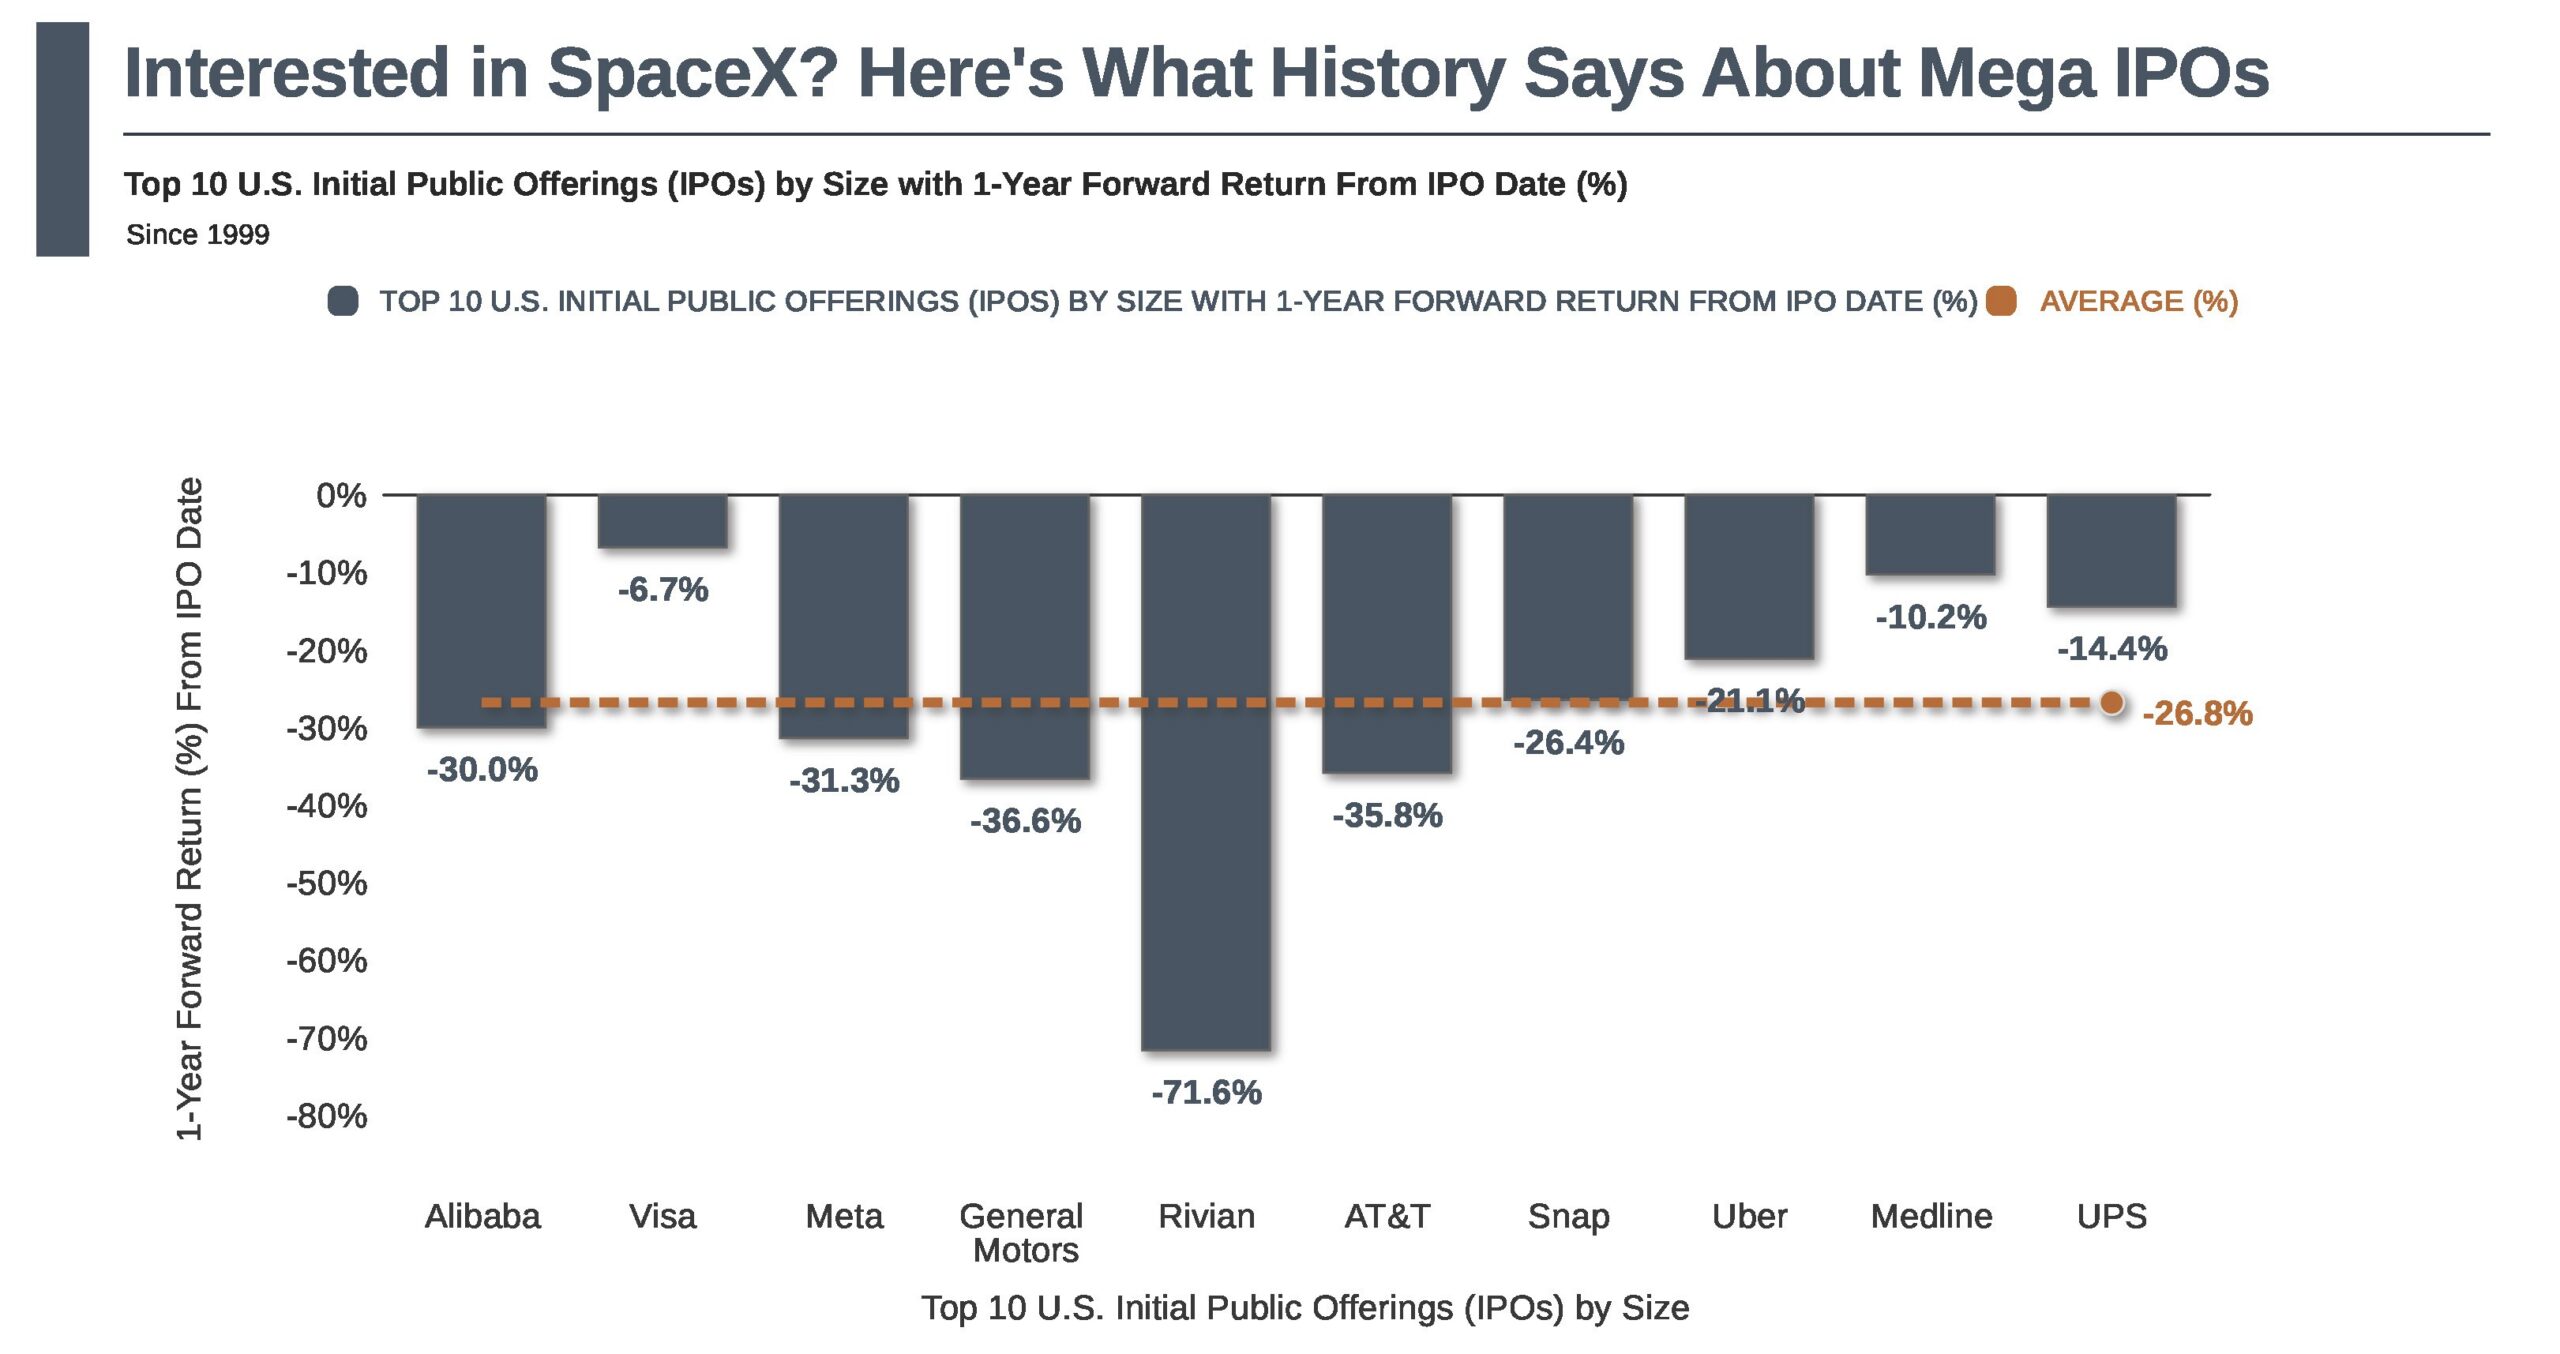
But is buying in at the IPO price a good idea? Let’s look at a chart of the 10 largest U.S. IPOs by deal size since 1999, showing how each performed over the following 12 months post-IPO:
Source: © Exhibit A, FactSet Research Systems Inc. | Latest: 2026-05-29
This slide is for informational and illustrative purposes only. The data provided is believed to be accurate, but there is no guarantee of its accuracy, completeness, or timeliness. This is not a recommendation or offer of any financial product. Past performance is not indicative of future results, and investors should consider their own objectives and risk tolerance. Indices, if presented, do not include fees, are unmanaged, and not available for direct investment. Definitions & Methodology: The chart ranks the 10 largest U.S. IPOs by total proceeds raised since 1999. The 1-year forward return is measured from each company’s IPO date to exactly 12 months later on a price return basis. IPO dates and 1-year forward return periods are as follows: Alibaba (9/19/2014 – 9/19/2015), Visa (3/19/2008 – 3/19/2009), Meta (5/18/2012 – 5/18/2013), General Motors (11/18/2010 – 11/18/2011), Rivian (11/11/2021 – 11/11/2022), AT&T (4/27/2000 – 4/27/2001), Snap (3/2/2017 – 3/2/2018), Uber (5/10/2019 – 5/10/2020), Medline (12/17/2025 – 5/28/2026), UPS (11/10/1999 – 11/10/2000). Medline’s 1-year forward return period is incomplete as the full 12-month window extends beyond the current date; return shown reflects performance through 5/28/2026. Returns are measured from the first trading day’s closing price for each IPO listed.
That’s an average return of -26.8%, which isn’t exactly Earth-shattering. It’s also not surprising, considering that many of these companies went public in an atmosphere of high optimism and investor enthusiasm, resulting in the shares being priced for perfection and potentially leaving less room for upside. In addition, as lockups for insiders expire post-IPO, selling pressure can drive prices down.2
Recent changes across major index providers have shortened IPO “seasoning periods.” FTSE Russell now allows certain large IPOs to be considered for inclusion as soon as five trading days after listing3, while Nasdaq may add eligible companies to the Nasdaq 100 in roughly 15 trading days4, down from prior waiting periods of several months.
Passive ETFs tracking these indexes may therefore need to add shares, either at scheduled rebalances or through expedited inclusion frameworks, depending on the index methodology. Investors in index-tracking ETFs may welcome incremental exposure to a high-profile company like SpaceX. However, some may question the relatively small allocation, or express concern about gaining exposure at elevated post-IPO valuations.
Addressing the former: Because index weights are typically based on float-adjusted market capitalization, the initial allocation would reflect only publicly tradable shares rather than the company’s full valuation, resulting in a more modest index weight based on reported or estimated float levels.
As to the latter: While some investors worry that index inclusion could force passive ETFs to buy shares at unattractive prices, this risk may be mitigated by the relatively small initial float-adjusted market capitalization, which limits immediate index demand. As the float expands over time, index allocations tend to increase incrementally, allowing purchases to occur across a broader range of price levels.
For investors unable to participate directly in an IPO, eventual index inclusion, whether immediate or gradual, may provide a more disciplined and diversified way to gain exposure over time, subject to index eligibility and fund methodology.
Bottom line: Beware IPO FOMO (fear of missing out). Historical return patterns following prior mega IPOs should give even the most enthusiastic investors pause when weighing the risk return tradeoff of seeking pre IPO exposure. While companies of this scale have historically found their way into major indexes over time (though not always immediately or at meaningful weights), investors typically gain exposure gradually through diversified funds and ETFs. In that sense, the discipline that underpins sound portfolio construction still applies. Rather than chasing the excitement of any single opportunity, long term outcomes are more often driven by maintaining diversified exposure and staying invested.