Equity Markets
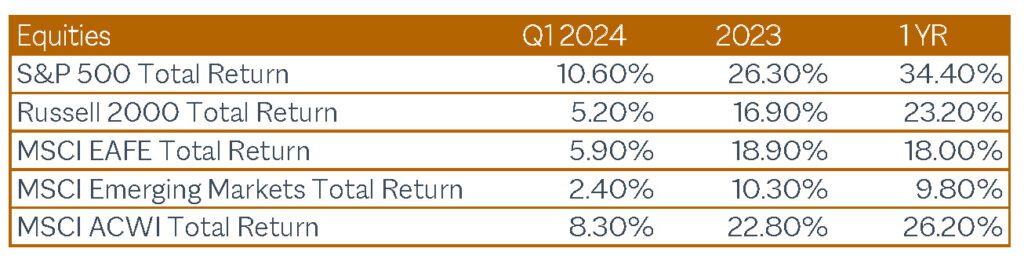
For the first quarter, large U.S. companies (represented by the S&P 500 index in the table below) continued to outperform small companies.
In the U.S., growth companies continued to outperform value companies.[1] This differential was more pronounced for small companies and narrowed for large companies.
The U.S. continued to outperform both international developed markets (represented by MSCI EAFE index) and emerging markets (represented by MSCI Emerging Markets index).
Equity markets started to rebound towards the end of October 2023.
Many headlines of late have been all about how just a few stocks have dominated returns. Some question why own anything else. Let’s dig a little deeper.
When we look back over the last 5 months, the reality does not show a narrow market, but rather a broad market advance. The chart below shows solid returns for the major equity asset classes since then. Note that while the S&P 500 is about +26%, the equal weight S&P 500 is also +26%. You simply don’t get that result if just a few stocks are driving returns. The S&P 600 Small Cap Index is also +25%, so the performance differential between large and small stocks has converged. We are encouraged by this broadening of the current market advance.
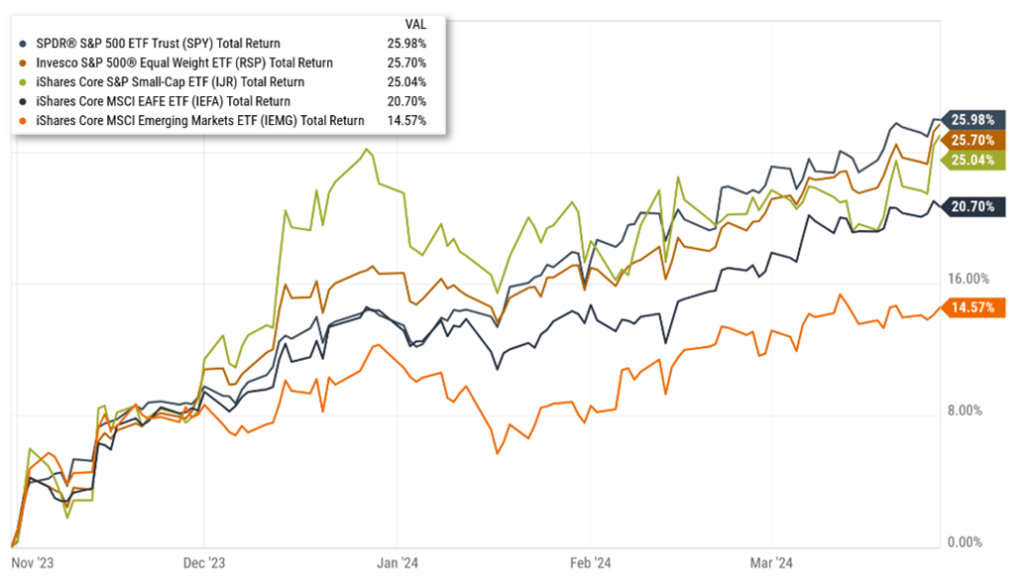
Source: YCharts. October 31, 2023 – March 31, 2024
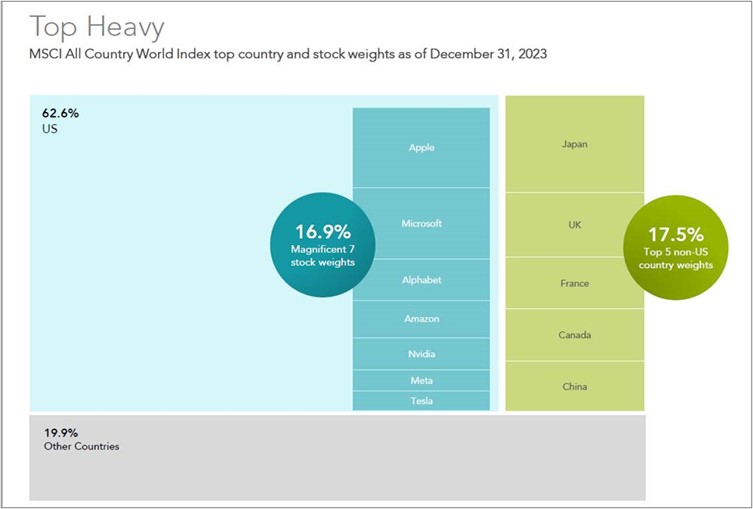
An interesting way to look at those few large stocks that have dominated returns over the past few years is shown below.
Data sourced using end of month holdings. Weight determined by constituent percentage of each respective index at the issuer level. Indices are not available for direct investment. Their performance does not reflect the expenses associated with the management of an actual portfolio. MSCI data © MSCI 2024, all rights reserved. This information is intended for educational purposes and should not be considered a recommendation to buy or sell a particular security. Named securities may be held in accounts managed by Dimensional.
It is fascinating to see that at current price levels, some of these companies are as large or larger than whole countries in the MSCI ACWI index. While we all have exposure to these companies through diversified fund investments, generally we prefer our clients to have slightly less exposure to large companies and more exposure to small and value companies, which historically has added to returns over time.
Fixed Income Markets
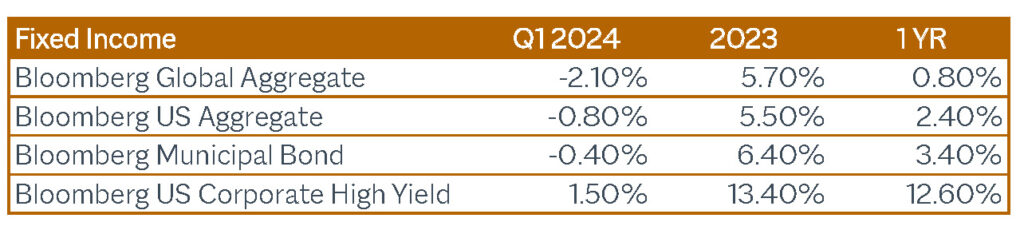
While most bond indexes, except for high yield, are slightly negative year-to-date, over the past year bond returns have been positive. The good news about the current interest rate environment is that as existing bonds pay coupons or mature, these proceeds can then be reinvested at higher rates.
Will short-term interest rates remain higher for longer? So far this year, that has been the case.
Expectations for rate cuts in 2024 have been reined in. At the start of 2024, the median prediction from economists surveyed by FactSet was for a total of four rate cuts of 0.25% each. At the same, Federal Funds Futures were predicting a total of six rate cuts of 0.25% each. As of March 31 of this year, the most likely scenarios are 3-4 cuts, with Fed Funds futures pricing in at about a 34% chance of three rate cuts and about a 19% chance of four cuts by the conclusion of the December 18, 2024 Federal Reserve meeting.
Target Rate Probabilities for December 18, 2024, Federal Reserve Meeting:
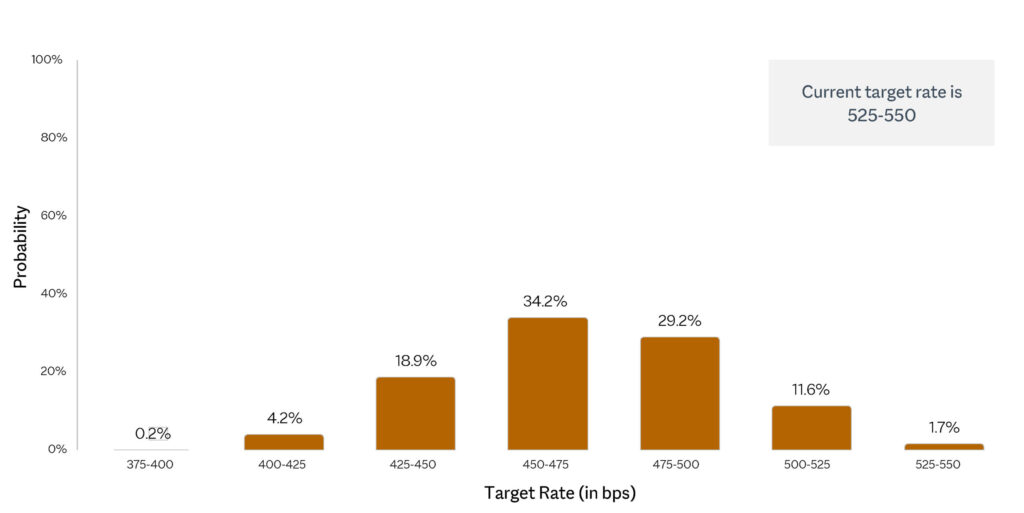
Source: Chicago Mercantile Exchange FedWatch Tool, https://www.cmegroup.com/markets/interest-rates/cme-fedwatch-tool.html
If short-term interest rates do remain near current levels for longer, it is not the end of the world. It just means better yields for all of us until the next rate-cutting cycle begins.
The Fed sets the short-term policy rate (or Federal Funds rate), which is used on overnight loans between banks. However, longer-term rates are determined by the bond market and participants’ expectations about a variety of items.
Expectations of higher short-term rates this year translated into a higher yield on the 10-year Treasury Note, which increased from 3.55% to 4.20% over the last 12 months.
Economic Growth
Real Gross Domestic Product (GDP) for the fourth quarter (seasonally adjusted annual rate) was recently revised slightly upward from 3.2% to 3.4%; a healthy level of growth.[2]
The current Blue Chip consensus estimate for first quarter 2024 real GDP growth is about 2%, while the Federal Reserve Bank of Atlanta’s “GDPNow” model estimates 2.8%. Long-term real GDP growth of around 3% appears realistic and would be close to the average of about 3.2% since 1947.[3]
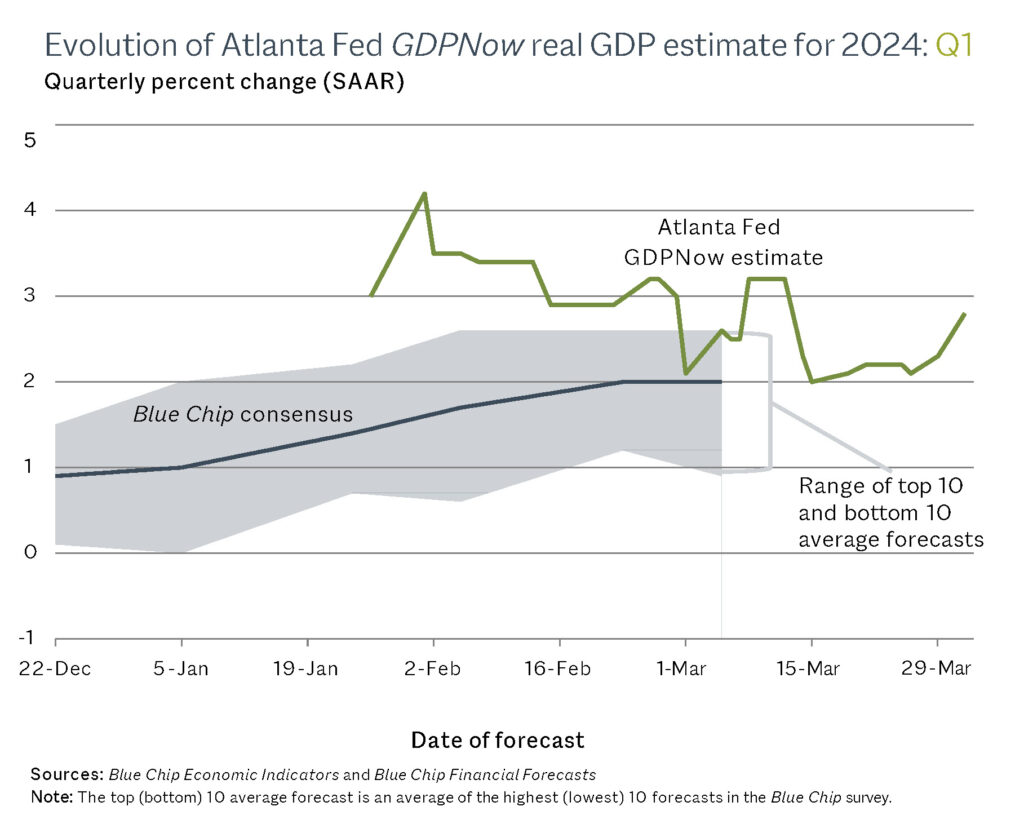
GDPNow is not an official forecast of the Atlanta Fed. Rather, it is best viewed as a running estimate of real GDP growth based on available economic data for the current measured quarter. There are no subjective adjustments made to GDPNow—the estimate is based solely on the mathematical results of the model.
Job Growth and Unemployment
For the first quarter of 2024, private jobs have grown by a total of over 800,000, including all available revisions. Unemployment remains low at 3.8% and has been in a narrow range of 3.7% to 3.9% since August 2023. The March nonfarm payroll gains of 303,000 exceed consensus expectations of 214,000 as well as the average over the last 12 months of 231,000. These are healthy measures.
Inflation
The most recent reading on the Consumer Price Index (CPI) was +3.2% year over year at the end of February. This was slightly higher than the consensus expectation of +3.1%, but down from rates over 6% seen as recently as February 28, 2023.
The overall Personal Consumption Expenditures (PCE) index was up +2.5% year over year through February. This is the Federal Reserve’s preferred measure and what they are targeting when they say their goal is 2% inflation. The most recent month over month PCE of 0.3% would translate into about 4% annualized inflation, well over their 2% long-term target.
We believe these inflation readings push rate cuts out into the future or make them less likely. And the recent increases in oil prices have yet to be fully in the CPI or PCE measures.
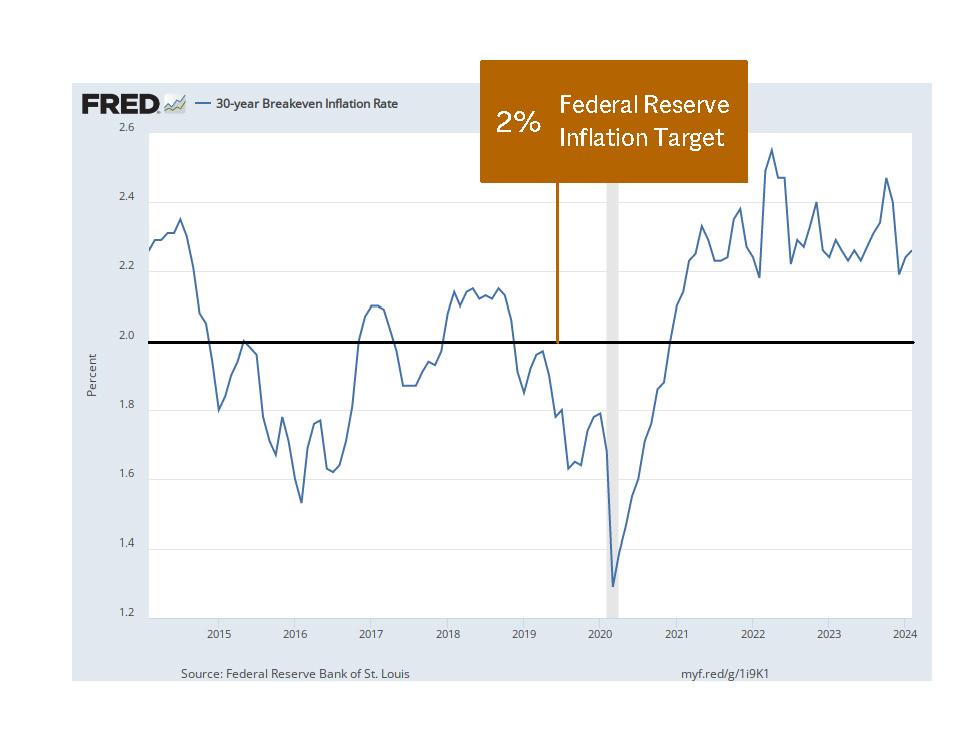
But looking longer term, the break-even inflation rate over the next 30 years is only 2.27% as of March 1, 2024. This is the level of inflation that the U.S. Treasury market is predicting over the next 30 years, and only recently returned to where it was 9 years ago. While the current CPI and PCE readings may be higher than the Fed would like, in the long run, the market is not predicting a sustained or runaway inflationary environment.
United States Elections
While it may be distressing if the presidential candidate we personally prefer (if any) does not win, history tells us in the long run it doesn’t really matter from a market perspective.
There is no discernable pattern between market returns and political control, and the good news is that most presidential terms have had positive stock market returns with 3 exceptions: Hoover (R, Great Depression), Roosevelt (D, 2nd term coming out of Depression into World War II), G.W. Bush (R, negative both terms, 9/11 and the end of the dot com boom occurred in his 1st term, and his 2nd term included most of the Great Recession).
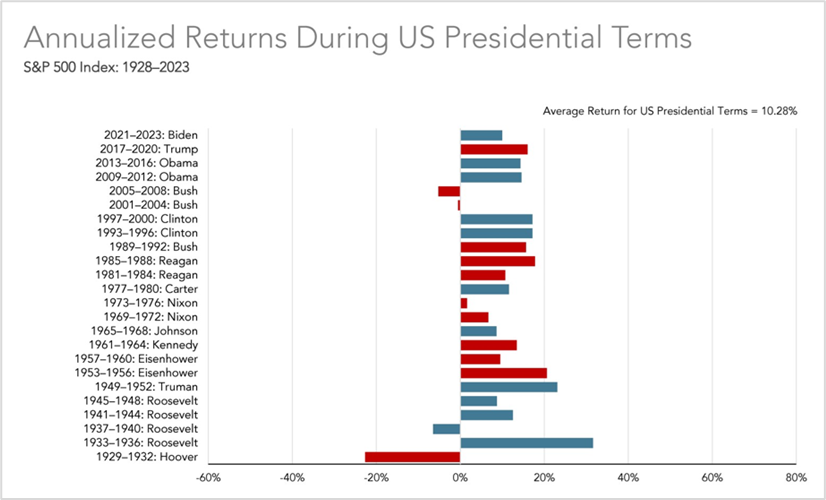
Past performance is not a guarantee of future results. Indices are not available for direct investment; therefore, their performance does not reflect the expenses associated with the management of an actual portfolio. Source: Dimensional Fund Advisors, S&P data © 2024 S&P Dow Jones Indices LLC, a division of S&P Global. All rights reserved.
Although the current gridlock in Washington, D.C. is painful to watch, markets have prospered over time regardless of congressional control:
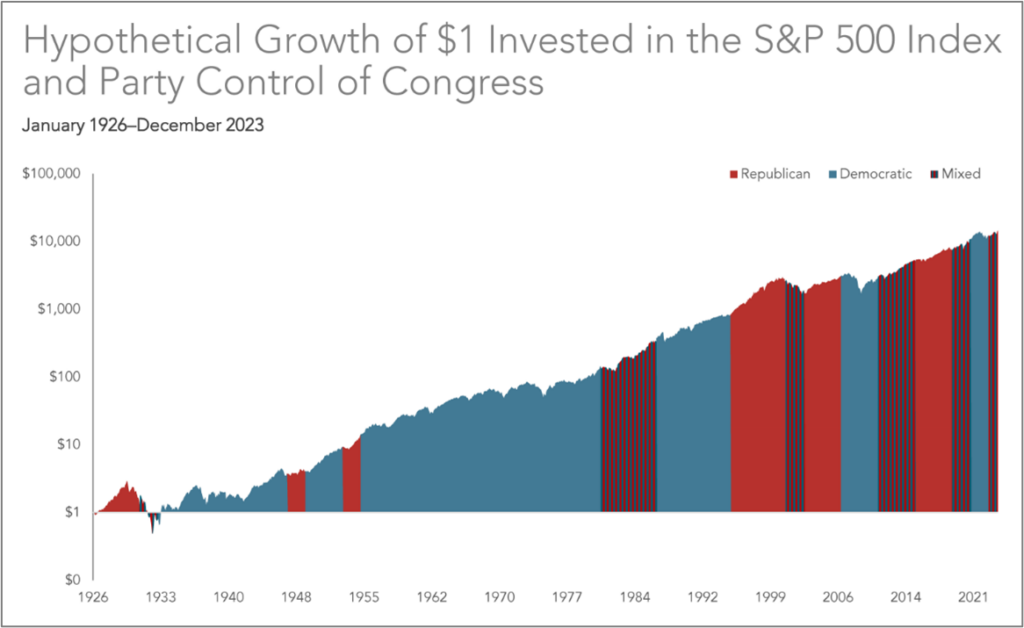
Past performance is not a guarantee of future results. Indices are not available for direct investment; therefore, their performance does not reflect the expenses associated with the management of an actual portfolio. Data presented in the growth of $1 chart is hypothetical and assume reinvestment of income and no transaction costs or taxes. The chart is for illustrative purposes only and is not indicative of any investment. Source: Dimensional Fund Advisors, S&P data © 2024 S&P Dow Jones Indices LLC, a division of S&P Global. All rights reserved.
Other fun facts about election years:[4]
- Since 1952, there have been only two losses in the S&P 500 during the last 7 months of a presidential election year.
- Since 1896, there have been only six election year declines greater than 5% in the Dow Jones Industrial Average.
- Since 1833, the election year has been the second best of the 4-year presidential cycle, with an average price gain of +6%.
While these are interesting observations by the 2024 Stock Trader’s Almanac, it is important to remember that there is a limited set of data we are able to examine, and future outcomes may vary.
Looking Forward
U.S. stock market performance has been strong, with the S&P 500 up +10.6% in the first quarter and +27.6% (excluding dividends) from the October 27, 2023 closing low of 4117.
Most analysts remain positive, with a consensus 12-month price target for the S&P 500 of 5675, which would be a total return of about 9% above current levels (including dividends).
Earnings growth is projected at +10.6% for 2024 and +13.4% for 2025, which are solid levels.[5]
RIP
Professor Daniel “Danny” Kahneman, 2002 Nobel prize winner for his work in behavioral finance, died at age 90 on March 27, 2024. He questioned the status quo and traditional finance assumptions of rationality with research that showed, for example, how financial losses feel twice as painful than gains of the same amount feel good.[6]
If you are interested in reading further, consider reading Kahneman’s book, “Fast and Slow” which deals with how we make choices and how we cannot always trust our intuition because of the way our brains function.
Another suggested read is “The Undoing Project: A Friendship that Changed our Minds,” by Michael Lewis. This is an entertaining account of the friendship between Kahneman and his research partner Amos Tversky, who died in 1996, and covers a lot of their work and its impact.
Conclusion
Economic growth remains solid, inflation measures remain in excess of the Fed’s 2% target but have come down significantly over the past year. Unemployment remains low and job creation healthy.
Short-term interest rates (Fed Funds) are unchanged since the end of the rapid rate increase cycle in July 2023. Longer-term interest rates (the 10-year Treasury Note) and mortgage rates are up slightly from a year ago but down from their peaks. Overall, a good combination of economic factors on balance.
There are always potential risks to contend with, whether it is the ever-present yet unpredictable geopolitical events, U.S. national debt or some other unforeseen crisis. The present is when we position our portfolios for success in the future. How do we do this? By maintaining our long-term focus, staying diversified, not reacting to short-term news or trends and most importantly by not making drastic changes to our asset allocation based on the mood of the day. In the words of Dr. Kahneman, “all of us would be better investors if we just made fewer decisions.”
Thank you for your continued confidence in Modera. We value our relationship with you and appreciate your trust in us. Please feel free to reach out to your advisor with any questions.
[1] JP Morgan Weekly Market Recap April 1, 2024
[2] https://www.bea.gov/
[3] https://www.atlantafed.org/cqer/research/gdpnow, FRED
[4] Hirsch and Mistal, Stock Trader’s Almanac 2024
[5] FactSet Earnings Insight, March 28, 2024
[6] WSJ Weekend Edition March 30 – March 31, 2024
GDPNow is not an official forecast of the Atlanta Fed. Rather, it is best viewed as a running estimate of real GDP growth based on available economic data for the current measured quarter. There are no subjective adjustments made to GDPNow—the estimate is based solely on the mathematical results of the model.
Indexes are unmanaged, statistical composites, and their returns do not reflect payment of fees an investor would pay to purchase the securities they represent. Such costs would lower performance. It is not possible to invest directly in an index. The indexes include a different number of securities and have different risk characteristics. Past performance of the indexes and benchmark is no indication of future returns.
YCharts ©2023 YCharts, Inc. All rights reserved. The information contained herein: (1) is proprietary to YCharts, Inc. and/or its content providers; (2) may not be copied, reproduced, retransmitted, or distributed; and (3) is provided AS IS with all faults and is not warranted to be accurate, complete, or timely. YCHARTS, INC. AND ITS CONTENT PROVIDERS EXPRESSLY DISCLAIM, TO THE FULLEST EXTENT PERMITTED BY APPLICABLE LAW, ANY WARRANTY OF ANY KIND, WHETHER EXPRESS OR IMPLIED, INCLUDING WARRANTIES OF MERCHANTABILITY, FITNESS FOR A PARTICULAR PURPOSE, ACCURACY OF INFORMATIONAL CONTENT, OR ANY IMPLIED WARRANTIES ARISING OUT OF COURSE OF DEALING OR COURSE OF PERFORMANCE. Neither YCharts, Inc. nor its content providers are responsible for any damages or losses arising from the use of this information. Past performance is no guarantee of future results. YCharts, Inc. (YCharts) is not registered with the U.S. Securities and Exchange Commission (or with the securities regulatory authority or body of any state or any other jurisdiction) as an investment adviser, broker-dealer or in any other capacity, and does not purport to provide investment advice or make investment recommendations. This report has been generated through the application of the analytical tools and data provided through ycharts.com and is intended solely to assist you or your investment or other adviser(s) in conducting investment research. You should not construe this report as an offer to buy or sell, as a solicitation of an offer to buy or sell, or as a recommendation to buy, sell, hold or trade, any security or other financial instrument. For further information regarding your use of this report, please go to: ycharts.com/about/disclosure.
Dimensional Fund Advisors LP is an investment advisor registered with the Securities and Exchange Commission. The information contained herein is subject to the terms of the End User License Agreement for Returns Program.
Performance for periods greater than one year are annualized unless specified otherwise. Selection of indices and time periods presented are chosen by advisor. Indices are not available for direct investment and performance does not reflect expenses of an actual portfolio.
Performance data shown represents past performance. Past performance is no guarantee of future results and current performance may be higher or lower than the performance shown.
S&P 500 Index: Total returns in USD. Source: Standard and Poors Index Services Group for the period January 1990 – present. Source Ibbotson data courtesy of © Stocks, Bonds, Bills and Inflation YearbookTM, Ibbotson Associates, Chicago (annually updated works by Roger C. Ibbotson and Rex A. Sinquefield for the period January 1926 to December 1989. Copyright 2023 Dow Jones Indices LLC, a division of S&P Global. All rights reserved.

Investment Commentary: Q1 2024
The Modera Wealth Research Team and I are happy to share our first quarter 2024 market and economic review.
Equity Markets
For the first quarter, large U.S. companies (represented by the S&P 500 index in the table below) continued to outperform small companies.
In the U.S., growth companies continued to outperform value companies.[1] This differential was more pronounced for small companies and narrowed for large companies.
The U.S. continued to outperform both international developed markets (represented by MSCI EAFE index) and emerging markets (represented by MSCI Emerging Markets index).
Equity markets started to rebound towards the end of October 2023.
Many headlines of late have been all about how just a few stocks have dominated returns. Some question why own anything else. Let’s dig a little deeper.
When we look back over the last 5 months, the reality does not show a narrow market, but rather a broad market advance. The chart below shows solid returns for the major equity asset classes since then. Note that while the S&P 500 is about +26%, the equal weight S&P 500 is also +26%. You simply don’t get that result if just a few stocks are driving returns. The S&P 600 Small Cap Index is also +25%, so the performance differential between large and small stocks has converged. We are encouraged by this broadening of the current market advance.
Source: YCharts. October 31, 2023 – March 31, 2024
An interesting way to look at those few large stocks that have dominated returns over the past few years is shown below.
Data sourced using end of month holdings. Weight determined by constituent percentage of each respective index at the issuer level. Indices are not available for direct investment. Their performance does not reflect the expenses associated with the management of an actual portfolio. MSCI data © MSCI 2024, all rights reserved. This information is intended for educational purposes and should not be considered a recommendation to buy or sell a particular security. Named securities may be held in accounts managed by Dimensional.
It is fascinating to see that at current price levels, some of these companies are as large or larger than whole countries in the MSCI ACWI index. While we all have exposure to these companies through diversified fund investments, generally we prefer our clients to have slightly less exposure to large companies and more exposure to small and value companies, which historically has added to returns over time.
Fixed Income Markets
While most bond indexes, except for high yield, are slightly negative year-to-date, over the past year bond returns have been positive. The good news about the current interest rate environment is that as existing bonds pay coupons or mature, these proceeds can then be reinvested at higher rates.
Will short-term interest rates remain higher for longer? So far this year, that has been the case.
Expectations for rate cuts in 2024 have been reined in. At the start of 2024, the median prediction from economists surveyed by FactSet was for a total of four rate cuts of 0.25% each. At the same, Federal Funds Futures were predicting a total of six rate cuts of 0.25% each. As of March 31 of this year, the most likely scenarios are 3-4 cuts, with Fed Funds futures pricing in at about a 34% chance of three rate cuts and about a 19% chance of four cuts by the conclusion of the December 18, 2024 Federal Reserve meeting.
Target Rate Probabilities for December 18, 2024, Federal Reserve Meeting:
Source: Chicago Mercantile Exchange FedWatch Tool, https://www.cmegroup.com/markets/interest-rates/cme-fedwatch-tool.html
If short-term interest rates do remain near current levels for longer, it is not the end of the world. It just means better yields for all of us until the next rate-cutting cycle begins.
The Fed sets the short-term policy rate (or Federal Funds rate), which is used on overnight loans between banks. However, longer-term rates are determined by the bond market and participants’ expectations about a variety of items.
Expectations of higher short-term rates this year translated into a higher yield on the 10-year Treasury Note, which increased from 3.55% to 4.20% over the last 12 months.
Economic Growth
Real Gross Domestic Product (GDP) for the fourth quarter (seasonally adjusted annual rate) was recently revised slightly upward from 3.2% to 3.4%; a healthy level of growth.[2]
The current Blue Chip consensus estimate for first quarter 2024 real GDP growth is about 2%, while the Federal Reserve Bank of Atlanta’s “GDPNow” model estimates 2.8%. Long-term real GDP growth of around 3% appears realistic and would be close to the average of about 3.2% since 1947.[3]
GDPNow is not an official forecast of the Atlanta Fed. Rather, it is best viewed as a running estimate of real GDP growth based on available economic data for the current measured quarter. There are no subjective adjustments made to GDPNow—the estimate is based solely on the mathematical results of the model.
Job Growth and Unemployment
For the first quarter of 2024, private jobs have grown by a total of over 800,000, including all available revisions. Unemployment remains low at 3.8% and has been in a narrow range of 3.7% to 3.9% since August 2023. The March nonfarm payroll gains of 303,000 exceed consensus expectations of 214,000 as well as the average over the last 12 months of 231,000. These are healthy measures.
Inflation
The most recent reading on the Consumer Price Index (CPI) was +3.2% year over year at the end of February. This was slightly higher than the consensus expectation of +3.1%, but down from rates over 6% seen as recently as February 28, 2023.
The overall Personal Consumption Expenditures (PCE) index was up +2.5% year over year through February. This is the Federal Reserve’s preferred measure and what they are targeting when they say their goal is 2% inflation. The most recent month over month PCE of 0.3% would translate into about 4% annualized inflation, well over their 2% long-term target.
We believe these inflation readings push rate cuts out into the future or make them less likely. And the recent increases in oil prices have yet to be fully in the CPI or PCE measures.
But looking longer term, the break-even inflation rate over the next 30 years is only 2.27% as of March 1, 2024. This is the level of inflation that the U.S. Treasury market is predicting over the next 30 years, and only recently returned to where it was 9 years ago. While the current CPI and PCE readings may be higher than the Fed would like, in the long run, the market is not predicting a sustained or runaway inflationary environment.
United States Elections
While it may be distressing if the presidential candidate we personally prefer (if any) does not win, history tells us in the long run it doesn’t really matter from a market perspective.
There is no discernable pattern between market returns and political control, and the good news is that most presidential terms have had positive stock market returns with 3 exceptions: Hoover (R, Great Depression), Roosevelt (D, 2nd term coming out of Depression into World War II), G.W. Bush (R, negative both terms, 9/11 and the end of the dot com boom occurred in his 1st term, and his 2nd term included most of the Great Recession).
Past performance is not a guarantee of future results. Indices are not available for direct investment; therefore, their performance does not reflect the expenses associated with the management of an actual portfolio. Source: Dimensional Fund Advisors, S&P data © 2024 S&P Dow Jones Indices LLC, a division of S&P Global. All rights reserved.
Although the current gridlock in Washington, D.C. is painful to watch, markets have prospered over time regardless of congressional control:
Past performance is not a guarantee of future results. Indices are not available for direct investment; therefore, their performance does not reflect the expenses associated with the management of an actual portfolio. Data presented in the growth of $1 chart is hypothetical and assume reinvestment of income and no transaction costs or taxes. The chart is for illustrative purposes only and is not indicative of any investment. Source: Dimensional Fund Advisors, S&P data © 2024 S&P Dow Jones Indices LLC, a division of S&P Global. All rights reserved.
Other fun facts about election years:[4]
While these are interesting observations by the 2024 Stock Trader’s Almanac, it is important to remember that there is a limited set of data we are able to examine, and future outcomes may vary.
Looking Forward
U.S. stock market performance has been strong, with the S&P 500 up +10.6% in the first quarter and +27.6% (excluding dividends) from the October 27, 2023 closing low of 4117.
Most analysts remain positive, with a consensus 12-month price target for the S&P 500 of 5675, which would be a total return of about 9% above current levels (including dividends).
Earnings growth is projected at +10.6% for 2024 and +13.4% for 2025, which are solid levels.[5]
RIP
Professor Daniel “Danny” Kahneman, 2002 Nobel prize winner for his work in behavioral finance, died at age 90 on March 27, 2024. He questioned the status quo and traditional finance assumptions of rationality with research that showed, for example, how financial losses feel twice as painful than gains of the same amount feel good.[6]
If you are interested in reading further, consider reading Kahneman’s book, “Fast and Slow” which deals with how we make choices and how we cannot always trust our intuition because of the way our brains function.
Another suggested read is “The Undoing Project: A Friendship that Changed our Minds,” by Michael Lewis. This is an entertaining account of the friendship between Kahneman and his research partner Amos Tversky, who died in 1996, and covers a lot of their work and its impact.
Conclusion
Economic growth remains solid, inflation measures remain in excess of the Fed’s 2% target but have come down significantly over the past year. Unemployment remains low and job creation healthy.
Short-term interest rates (Fed Funds) are unchanged since the end of the rapid rate increase cycle in July 2023. Longer-term interest rates (the 10-year Treasury Note) and mortgage rates are up slightly from a year ago but down from their peaks. Overall, a good combination of economic factors on balance.
There are always potential risks to contend with, whether it is the ever-present yet unpredictable geopolitical events, U.S. national debt or some other unforeseen crisis. The present is when we position our portfolios for success in the future. How do we do this? By maintaining our long-term focus, staying diversified, not reacting to short-term news or trends and most importantly by not making drastic changes to our asset allocation based on the mood of the day. In the words of Dr. Kahneman, “all of us would be better investors if we just made fewer decisions.”
Thank you for your continued confidence in Modera. We value our relationship with you and appreciate your trust in us. Please feel free to reach out to your advisor with any questions.
[1] JP Morgan Weekly Market Recap April 1, 2024
[2] https://www.bea.gov/
[3] https://www.atlantafed.org/cqer/research/gdpnow, FRED
[4] Hirsch and Mistal, Stock Trader’s Almanac 2024
[5] FactSet Earnings Insight, March 28, 2024
[6] WSJ Weekend Edition March 30 – March 31, 2024
GDPNow is not an official forecast of the Atlanta Fed. Rather, it is best viewed as a running estimate of real GDP growth based on available economic data for the current measured quarter. There are no subjective adjustments made to GDPNow—the estimate is based solely on the mathematical results of the model.
Indexes are unmanaged, statistical composites, and their returns do not reflect payment of fees an investor would pay to purchase the securities they represent. Such costs would lower performance. It is not possible to invest directly in an index. The indexes include a different number of securities and have different risk characteristics. Past performance of the indexes and benchmark is no indication of future returns.
YCharts ©2023 YCharts, Inc. All rights reserved. The information contained herein: (1) is proprietary to YCharts, Inc. and/or its content providers; (2) may not be copied, reproduced, retransmitted, or distributed; and (3) is provided AS IS with all faults and is not warranted to be accurate, complete, or timely. YCHARTS, INC. AND ITS CONTENT PROVIDERS EXPRESSLY DISCLAIM, TO THE FULLEST EXTENT PERMITTED BY APPLICABLE LAW, ANY WARRANTY OF ANY KIND, WHETHER EXPRESS OR IMPLIED, INCLUDING WARRANTIES OF MERCHANTABILITY, FITNESS FOR A PARTICULAR PURPOSE, ACCURACY OF INFORMATIONAL CONTENT, OR ANY IMPLIED WARRANTIES ARISING OUT OF COURSE OF DEALING OR COURSE OF PERFORMANCE. Neither YCharts, Inc. nor its content providers are responsible for any damages or losses arising from the use of this information. Past performance is no guarantee of future results. YCharts, Inc. (YCharts) is not registered with the U.S. Securities and Exchange Commission (or with the securities regulatory authority or body of any state or any other jurisdiction) as an investment adviser, broker-dealer or in any other capacity, and does not purport to provide investment advice or make investment recommendations. This report has been generated through the application of the analytical tools and data provided through ycharts.com and is intended solely to assist you or your investment or other adviser(s) in conducting investment research. You should not construe this report as an offer to buy or sell, as a solicitation of an offer to buy or sell, or as a recommendation to buy, sell, hold or trade, any security or other financial instrument. For further information regarding your use of this report, please go to: ycharts.com/about/disclosure.
Dimensional Fund Advisors LP is an investment advisor registered with the Securities and Exchange Commission. The information contained herein is subject to the terms of the End User License Agreement for Returns Program.
Performance for periods greater than one year are annualized unless specified otherwise. Selection of indices and time periods presented are chosen by advisor. Indices are not available for direct investment and performance does not reflect expenses of an actual portfolio.
Performance data shown represents past performance. Past performance is no guarantee of future results and current performance may be higher or lower than the performance shown.
S&P 500 Index: Total returns in USD. Source: Standard and Poors Index Services Group for the period January 1990 – present. Source Ibbotson data courtesy of © Stocks, Bonds, Bills and Inflation YearbookTM, Ibbotson Associates, Chicago (annually updated works by Roger C. Ibbotson and Rex A. Sinquefield for the period January 1926 to December 1989. Copyright 2023 Dow Jones Indices LLC, a division of S&P Global. All rights reserved.
Follow us on social:
Related Articles:
Talk to an experienced financial planner
Related Articles:
Modera Wealth Management, LLC (Modera) is an SEC-registered investment adviser. SEC registration does not imply any level of skill or training. For information pertaining to our registration status, the fees we charge including how we are compensated and by whom, additional costs that may be incurred, our conflicts of interest, any disclosed disciplinary events of the Firm or its personnel, and the types of services we offer, please contact us directly or refer to the Investment Adviser Public Disclosure web site (www.adviserinfo.sec.gov) to obtain a copy of our disclosure statement, Form ADV Part 2A, and ADV Part 3/Form CRS. In addition, our Privacy Notice outlines how we handle your non-public personal information. Please read these documents carefully before you make a decision to hire Modera, invest or send money.
This material is limited to the dissemination of general information about Modera’s investment advisory and financial planning services that is not suitable for everyone. Nothing herein should be interpreted or construed as investment advice nor as legal, tax or accounting advice nor as personalized financial planning, tax planning or wealth management advice. For legal, tax and accounting-related matters, we recommend you seek the advice of a qualified attorney or accountant. This material is not a substitute for personalized investment or financial planning from Modera. There is no guarantee that the views and opinions expressed herein will come to pass, and the information herein should not be considered a solicitation to engage in a particular investment or financial planning strategy. The statements and opinions expressed in this material are relevant as of the date of publication and are subject to change without notice based on changes in the law and other conditions.
Investing in the markets involves gains and losses and may not be suitable for all investors. Information herein is subject to change without notice and should not be considered a solicitation to buy or sell any security or to engage in a particular investment or financial planning strategy. Individual client asset allocations and investment strategies differ based on varying degrees of diversification and other factors. Diversification does not guarantee a profit or guarantee against a loss.
Certified Financial Planner Board of Standards, Inc. (CFP Board) owns the certification marks CFP®, CERTIFIED FINANCIAL PLANNER®, and CFP® (with plaque design) in the United States, which it authorizes use of by individuals who successfully complete CFP Board’s initial and ongoing certification requirements.